205 - Simple Maps: World Cities and Countries#
For this exercise we will use the (Basic) CSV data from Simple Maps World Cities and Simple Maps Countries.
To do this you can execute the following commands in your working area (e.g. your cloned repository on BinderHub or your laptop):
mkdir -p assets
curl -O http://research-software-collaborations.org/python-june2025/_static/assets/simplemaps_countries_basicv1.0.zip
curl -O http://research-software-collaborations.org/python-june2025/_static/assets/simplemaps_worldcities_basicv1.901.zip
unzip simplemaps_countries_basicv1.0.zip
unzip simplemaps_worldcities_basicv1.901.zip
cd ..
After you have done that you should have files:
assets/simplemaps_countries_basicv1.0/countries.csv
assets/simplemaps_worldcities_basicv1.901/worldcities.csv
You should also get the following file and unpack it in the same directory where you will be creating files for your exercises:
curl -O http://research-software-collaborations.org/python-june2025/_static/assets/hsflib.zip
unzip hsflib.zip
At that point you can start the exercise.
import pandas as pd
import matplotlib.pyplot as plt
The data we have includes information on latitude and longitude of various cities. There is a large infrastructure (in Python and beyond) for managing geographic information, maps, etc. (Often referred to as Geogrpahic Information System (GIS).) We don’t intend for you to need to learn about that here, so we have encapsulated a simplified version of that in some functions that you can use to get a plotting surface set up with x and y limits set for longitude and latitude and with a faint background showing the coastlines of the various continents and islands.
To use that, you need to do the following one time in your notebook or program.
import hsflib
all_polygons_coords = hsflib.load_shapefile()
Then each time you want to plot something, call hsflib.setup_map(all_polygons_coords) as you would normally call plt.figure(...).
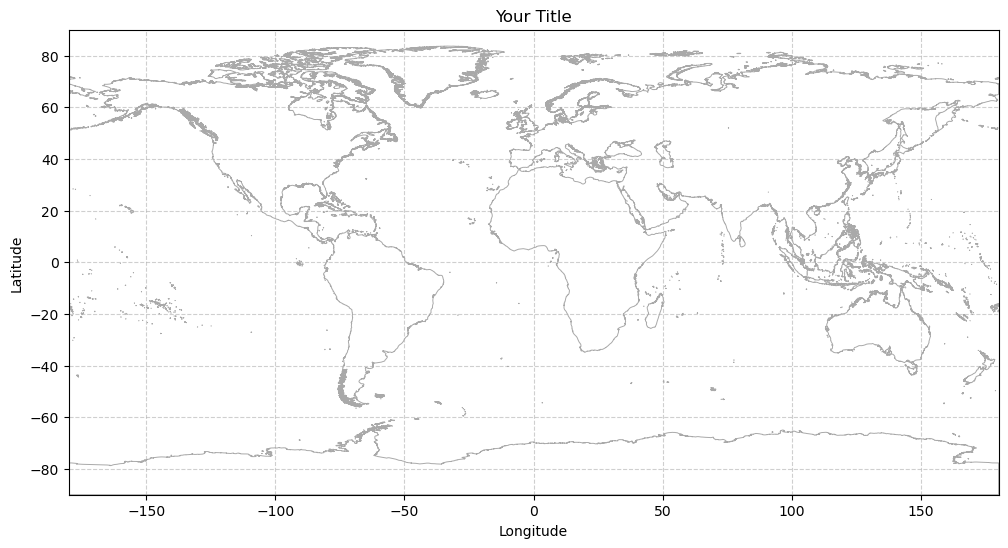
Here we show to plot with no data overlaid.
fig, ax = hsflib.setup_map(all_polygons_coords)
plt.show()
For this exercise you should load the city data:
df_cities = pd.read_csv('../assets/simplemaps_worldcities_basicv1.901/worldcities.csv')
df_cities.head(10)
| city | city_ascii | lat | lng | country | iso2 | iso3 | admin_name | capital | population | id | |
|---|---|---|---|---|---|---|---|---|---|---|---|
| 0 | Tokyo | Tokyo | 35.6870 | 139.7495 | Japan | JP | JPN | Tōkyō | primary | 37785000.0 | 1392685764 |
| 1 | Jakarta | Jakarta | -6.1750 | 106.8275 | Indonesia | ID | IDN | Jakarta | primary | 33756000.0 | 1360771077 |
| 2 | Delhi | Delhi | 28.6100 | 77.2300 | India | IN | IND | Delhi | admin | 32226000.0 | 1356872604 |
| 3 | Guangzhou | Guangzhou | 23.1300 | 113.2600 | China | CN | CHN | Guangdong | admin | 26940000.0 | 1156237133 |
| 4 | Mumbai | Mumbai | 19.0761 | 72.8775 | India | IN | IND | Mahārāshtra | admin | 24973000.0 | 1356226629 |
| 5 | Manila | Manila | 14.5958 | 120.9772 | Philippines | PH | PHL | Manila | primary | 24922000.0 | 1608618140 |
| 6 | Shanghai | Shanghai | 31.2286 | 121.4747 | China | CN | CHN | Shanghai | admin | 24073000.0 | 1156073548 |
| 7 | São Paulo | Sao Paulo | -23.5504 | -46.6339 | Brazil | BR | BRA | São Paulo | admin | 23086000.0 | 1076532519 |
| 8 | Seoul | Seoul | 37.5667 | 126.9833 | Korea, South | KR | KOR | Seoul | primary | 23016000.0 | 1410836482 |
| 9 | Mexico City | Mexico City | 19.4333 | -99.1333 | Mexico | MX | MEX | Ciudad de México | primary | 21804000.0 | 1484247881 |
And you should load the country data:
df_countries = pd.read_csv('../assets/simplemaps_countries_basicv1.0/countries.csv')
df_countries.head(10)
| country | demonym | id | iso2 | tld | currency | population | density | area | gdp | median_age | language | website | calling_code | driving_side | continent | un_member | religion | |
|---|---|---|---|---|---|---|---|---|---|---|---|---|---|---|---|---|---|---|
| 0 | China | Chinese | CN | CN | .cn | Chinese Yuan | 1.413143e+09 | 147.2 | 9596960.0 | 17963170.0 | 39.8 | Chinese | https://www.gov.cn | 86.0 | right | Asia | True | No Religion |
| 1 | India | Indian | IN | IN | .in | Indian Rupee | 1.399180e+09 | 425.6 | 3287263.0 | 3465541.0 | 29.5 | Hindi | http://india.gov.in | 91.0 | left | Asia | True | Hinduism |
| 2 | United States | American | US | US | .us | United States Dollar | 3.396651e+08 | 34.5 | 9833517.0 | 25744100.0 | 38.5 | English | https://www.usa.gov | 1.0 | right | North America | True | Christianity |
| 3 | Indonesia | Indonesian | ID | ID | .id | Rupiah | 2.794763e+08 | 146.7 | 1904569.0 | 1319100.0 | 31.2 | Indonesian | https://indonesia.go.id | 62.0 | left | Asia | True | Islam |
| 4 | Pakistan | Pakistani | PK | PK | .pk | Pakistani Rupee | 2.476536e+08 | 311.1 | 796095.0 | 326796.0 | 22.7 | Urdu | http://www.pakistan.gov.pk | 92.0 | left | Asia | True | Islam |
| 5 | Nigeria | Nigerian | NG | NG | .ng | Naira | 2.308427e+08 | 249.9 | 923768.0 | 15414.0 | 19.2 | English | https://nigeria.gov.ng | 234.0 | right | Africa | True | Christianity |
| 6 | Brazil | Brazilian | BR | BR | .br | Brazilian Real | 2.186898e+08 | 25.7 | 8515770.0 | 1920095.0 | 34.7 | Portuguese | https://www.gov.br | 55.0 | right | South America | True | Christianity |
| 7 | Bangladesh | Bangladeshi | BD | BD | .bd | Bangladeshi Taka | 1.671845e+08 | 1126.1 | 148460.0 | 432677.0 | 29.2 | Bengali | http://www.bangladesh.gov.bd | 880.0 | left | Asia | True | Islam |
| 8 | Russia | Russian | RU | RU | .ru | Russian Ruble | 1.416989e+08 | 8.3 | 17098242.0 | 2240422.0 | 41.5 | Russian | http://gov.ru | 7.0 | right | Europe | True | Christianity |
| 9 | Mexico | Mexican | MX | MX | .mx | Mexican Peso | 1.298755e+08 | 66.1 | 1964375.0 | 1463323.0 | 30.6 | Spanish | https://www.gob.mx | 52.0 | right | North America | True | Christianity |
Not that for invididual cities, you can get the iso2 code for the country in which they are located and then look up various bits of information for that country. In this exercise, you should try to make plots of all cities satisfying various criteria that require you to look up things in the country dataframe. For example:
all cities in countries where Spanish is the (main) language
all cities in countries which are in countries that have a population greater than 50 million people
Try also combining criteria and also creating plots which focus on particular continents. Make at least 8 such plots. (Don’t forget to plot first the underlying continent/coastline plot for most of these, but also make one plot in which you plot all cities in the list, but without the continent/coastline graphic.)