111 - Mandelbrot Set#
Generate an image of the Mandelbrot Set:
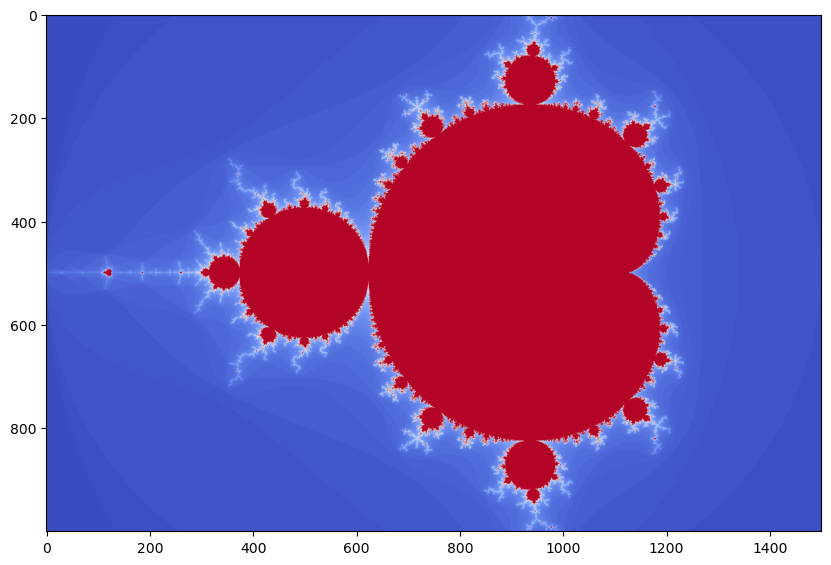
The algorithm is the following:
choose a grid of points in the imaginary plane, for example:
1500 values from x = -2.0 to 1.0, and
1000 values from y = -1.0 to 1.0
we will iterate though all of those points and for each:
create a complex number c corresponding to the point (and initial value of z=0)
while z is less than 2 units from the origin and the number of iterations for this point is less than 100
calculate \(z = z^2 + c\)
track the number of iterations for the original point c before one of the two conditions is no longer satisfied
Make a plot of the iterations for all points in the original grid (hint: use plt.imshow with cmap=’coolwarm’, for example)